The crypto market is in full meltdown mode right now, and if you’re wondering what the heck is going on — you’re not alone. Bitcoin has dropped from above $80,000 to the low $60,000s, altcoins are getting absolutely wrecked, and the total crypto market cap has shed hundreds of billions. In this video, I break down exactly what’s driving this crash and what it means for the market going forward.
The Crypto Crash Reason Everyone’s Talking About
Let me be real with you — there isn’t just one crypto crash reason behind this dump. It’s a perfect storm of multiple factors hitting the market at the same time. But if I had to point to the single biggest catalyst, it’s leverage unwinding. According to Reuters, over $2.56 billion in leveraged crypto positions were liquidated in just a matter of days. That’s an insane amount of forced selling hitting the market all at once.
What happens is pretty straightforward: traders borrow money to make bigger bets on crypto going up. When the price starts dropping, their positions get automatically closed out — which dumps even more crypto onto the market, pushing prices lower, which triggers more liquidations. It’s a vicious cycle, and once it starts, it feeds on itself until the leverage is flushed out.
Bitcoin ETF Outflows Are Making Things Worse
Here’s something that wasn’t a factor in previous bear markets: Bitcoin ETF outflows. According to data from CoinShares, Bitcoin ETFs have seen consistent net outflows over several weeks, with institutional investors pulling out roughly $1.7 billion. That’s a massive reversal from the euphoric inflows we saw when these ETFs first launched.
When institutions redeem their ETF shares, the fund managers have to sell actual Bitcoin on the open market. So these outflows translate directly into real selling pressure. It’s not just paper losses — it’s actual coins being dumped. And when the biggest players in the room are heading for the exits, retail investors tend to panic and follow.
The October 2025 Crash Still Haunts This Market
To really understand why we’re here, you have to look back to October 10, 2025. That was the day everything changed. As US Funds reported, over $19 billion in leveraged positions were wiped out in hours, and Bitcoin plummeted from roughly $122,000 to $105,000. That single event broke the market’s structure.
Since then, Bitcoin has been in a sustained downtrend. October, November, December 2025, and January 2026 all closed in the red — that’s the longest monthly losing streak since the 2018 bear market. According to CryptoSlate, if February also closes red, it would mark Bitcoin’s most prolonged bearish period in history.
Macro Conditions Are Not Helping
The broader economic picture isn’t doing crypto any favors either. The Federal Reserve’s hawkish stance on monetary policy means less liquidity flowing into speculative assets. As one analyst from Julius Baer put it to Reuters: “A smaller balance sheet is not going to provide any tailwinds for crypto.”
Geopolitical tensions are adding fuel to the fire as well. When there’s uncertainty in global markets, investors tend to move away from risk assets — and crypto is still very much in that category. The combination of tighter monetary policy, geopolitical risk, and weakening stock markets has created an environment where crypto simply can’t catch a bid.
Fear Has Taken Over
The sentiment indicators are deep in “extreme fear” territory right now. And I get it — watching your portfolio bleed day after day is brutal. According to a Coin360 analysis, retail participation has dropped sharply since mid-2025, with Deutsche Bank research showing that crypto usage among US consumers has fallen significantly.
The New York Times has even called this slide “one of the worst crises in the crypto industry since 2022.” And The Atlantic published a piece noting that Bitcoin “has come to feel less like a rebel upstart, more like an eccentric uncle.” Ouch. When mainstream media starts writing crypto obituaries, you know sentiment is at rock bottom.
How Bad Could It Get?
Let’s talk worst-case scenarios, because I know that’s what everyone wants to know. Some strategists are warning that if this develops into a full-scale crypto winter, Bitcoin could decline toward $31,000 — representing a potential 70-75% peak-to-trough drop, according to CCN. That would mirror the severity of the 2022 bear market.
On-chain metrics from BeInCrypto suggest that capital rotation remains weak, and the current pattern resembles early bear market transitions we’ve seen historically. However, most reputable analysts still see Bitcoin holding above $55,000 even in harsh scenarios.
But It’s Not All Doom and Gloom
Here’s the thing I want to emphasize: nothing is fundamentally broken with crypto. Bitcoin’s blockchain didn’t fail. There was no security breach. Mining continues normally. Transactions are settling as expected. This is a market-driven crash, not a technological one.
The underlying technology hasn’t changed. The use cases haven’t disappeared. What we’re seeing is a painful but historically normal correction in a market that got way too leveraged and overheated. Bitcoin has gone through 70%+ drawdowns multiple times in its history and has always come back stronger.
What I’m Watching Next
The key level everyone is watching right now is $70,000 for Bitcoin. If that holds as support, we could see a relief rally. If it breaks convincingly, the next major support zone is in the $55,000-$60,000 range. Either way, I think the most important thing right now is to stay informed, manage your risk, and not make emotional decisions.
This crash is painful, but it’s also creating opportunities for those who are patient and strategic. The crypto crash reason this time around is clear: too much leverage, institutional pullback, and a tough macro environment. But none of those things are permanent. Markets cycle, and this one will too.
Make sure to watch the full video above for my complete breakdown, and stay tuned for more updates as this situation develops.
Nvidia is about to drop its Q4 FY2026 earnings on February 25th, and honestly, the entire market — crypto included — is holding its breath. With Bitcoin hovering around $67,000 and broader sentiment teetering between fear and cautious optimism, Nvidia’s results could be the catalyst that either sends crypto soaring or triggers another leg down. Let me break down why Nvidia might have just saved Bitcoin, and what this means for the crypto market going forward.
Why Nvidia Matters to Bitcoin More Than You Think
If you’re wondering why a chip company’s earnings report matters for Bitcoin, you’re not alone — but the connection runs deeper than most people realize. Nvidia has become the backbone of the AI revolution, and AI infrastructure is now deeply intertwined with the crypto ecosystem. Bitcoin miners have been pivoting hard into AI hosting, repurposing their data centers and energy contracts to serve AI workloads alongside traditional mining operations.
This isn’t just a side hustle — it’s a fundamental shift. Companies that used to be pure Bitcoin mining plays are now marketing themselves as power-and-rackspace operators, pitching their cooling capacity and data-center footprints to AI customers. When Nvidia does well, it signals that AI demand is booming, which directly benefits these hybrid mining-AI companies and, by extension, the broader crypto market sentiment.
The Nvidia-Bitcoin Correlation Is Real
We’ve seen this play out before. Back in November 2025, Nvidia’s blockbuster earnings literally rescued Bitcoin from a downturn. The pattern is becoming predictable: Nvidia beats expectations, risk-on sentiment floods back into markets, and Bitcoin catches a bid. It’s not a coincidence — institutional investors increasingly view both Nvidia and Bitcoin as “risk-on” assets in the same macro bucket.
Right now, Wall Street analysts are expecting Nvidia to crush earnings again. After twelve consecutive quarters of beats and shares up 35% over the past year, the momentum is undeniable. Goldman Sachs has maintained a Buy rating with a $250 price target, projecting 2027 revenue of $382.9 billion. If Nvidia delivers another blowout quarter, expect Bitcoin to ride that wave higher.
The Rubin Platform Changes Everything
Here’s where it gets really interesting. At CES earlier this year, Jensen Huang revealed that Nvidia’s next-generation Vera Rubin platform is already in full production. This thing is a beast — each server packs 72 GPUs and 36 CPUs, and they can be linked into massive “pods” containing over 1,000 chips. Huang claims Rubin can deliver five times the AI computing power of previous systems, with roughly 10x improvement in token generation efficiency.
Why does this matter for crypto? Because the AI infrastructure buildout is creating enormous demand for exactly the kind of facilities that Bitcoin miners already operate. CoreWeave will be among the first to receive Rubin systems, with Microsoft, Oracle, Amazon, and Alphabet expected to follow. This tidal wave of AI spending flows directly through the same infrastructure pipeline that supports crypto mining operations.
Bitcoin Miners Are Becoming AI Infrastructure Companies
The smartest Bitcoin miners saw this coming. Instead of relying purely on mining margins — which can be brutal during down cycles — they’ve been repositioning as infrastructure providers. Hosting AI workloads generates steadier cash flows, especially for firms with cheap power, existing sites, and serious cooling capacity.
But there’s a catch. The AI boom is also raising the bar significantly. Data-center space is becoming a premium asset, with the best sites getting bid up by hyperscalers, cloud firms, and AI startups. This can lift rents, equipment costs, and financing hurdles for smaller miners. As CoinDesk reported, miners that look like infrastructure companies may win in 2026, while those relying on pure mining margins face a much tougher road ahead.
The $54 Billion Nvidia Gamble
There’s also a geopolitical angle here that could impact crypto markets. China had been preparing to receive over 2 million H200 units in 2026, representing roughly $54 billion in gross chip value at the reported $27,000 per unit price point. Any disruption to these shipments — whether from export controls or supply chain issues — could trigger volatility across both tech stocks and crypto markets, since institutional portfolios increasingly hold both.
Bitcoin is essentially trapped in this Nvidia-centric macro narrative. When Nvidia thrives, the “tech and innovation” trade thrives, and Bitcoin benefits as part of that basket. When there’s uncertainty around Nvidia, that fear bleeds into crypto too.
What This Means for Crypto Investors
So what should you actually do with this information? Here’s my take:
First, pay close attention to Nvidia’s earnings call on February 25th. It’s not just about the numbers — listen for guidance on AI infrastructure spending, Rubin deployment timelines, and any commentary about data center demand. These are all leading indicators for the crypto infrastructure play.
Second, watch the Bitcoin mining stocks. Companies like Marathon Digital, Riot Platforms, and Core Scientific that have successfully pivoted to hybrid mining-AI models could see outsized moves based on Nvidia’s results. If Nvidia signals continued AI demand growth, these stocks — and Bitcoin itself — could rally hard.
Third, don’t ignore the broader macro picture. With “Bitcoin to zero” searches hitting record highs in the U.S. this month (historically a contrarian bottom signal), and retail anxiety elevated, a strong Nvidia earnings report could be exactly the catalyst needed to flip sentiment from fear back to greed.
The Bottom Line
The relationship between Nvidia and crypto has evolved far beyond GPU mining. We’re now in an era where Nvidia’s success directly fuels the AI infrastructure buildout that Bitcoin miners depend on, where institutional money flows between tech stocks and crypto based on the same risk-on/risk-off signals, and where a single earnings report from a chip company can move the entire crypto market.
Did Nvidia just save Bitcoin? We’ll know for sure after February 25th. But the setup is there — twelve consecutive earnings beats, the Rubin platform in production, and a crypto market that’s been waiting for a catalyst. If Nvidia delivers, Bitcoin could be in for a very good week. And honestly, I’m cautiously optimistic. The convergence of AI and crypto isn’t slowing down — it’s accelerating. And Nvidia is right at the center of it all.
The crypto market has been absolutely brutal lately, and if you’ve been watching your portfolio bleed, you’re not alone. I came across this video from Tom Lee — the Fundstrat co-founder who’s been one of Wall Street’s most vocal Bitcoin bulls — and he breaks down exactly why crypto is dumping right now. Let me walk you through what he said and add some extra context I dug up.
The Crypto Bloodbath in Numbers
Before we get into Tom Lee’s take, let’s set the scene. Bitcoin has dropped over 50% from its all-time high of around $126,000 back in October 2025. In early February 2026, BTC briefly broke below $61,000 — a level that would have seemed unthinkable just a few months ago. And it’s not just Bitcoin. Ethereum pulled back over 33% in a single week, and Solana hit a two-year low around $88. According to CNBC, more than $2 billion in leveraged positions were liquidated in just one week. The total crypto market lost roughly $2 trillion in value during this sell-off, per Reuters.
Tom Lee’s Explanation: Why Crypto Is Dumping
So what does Tom Lee think is going on? In his view, this isn’t some random crash — it’s a structural reset. He’s been saying that 2026 would be “a year of two halves,” and the first half was always going to be rough. Here’s the core of his argument:
The dump is largely driven by institutional repositioning. The same big players — hedge funds, ETF managers, corporate treasuries — that fueled the rally to $126K are now rebalancing their portfolios. CryptoQuant confirmed this in a recent report, noting that “institutional demand has reversed materially.” U.S. Bitcoin ETFs, which were once absorbing massive amounts of BTC, have seen significant outflows.
Lee also points to de-leveraging as a major factor. He compared the current environment to the period after the FTX collapse, where forced liquidations create a cascading effect. When overleveraged traders get margin-called, their positions are automatically sold, which pushes prices lower, which triggers more liquidations. It’s a vicious cycle, and we’ve seen billions wiped out through this mechanism alone.
The Macro Backdrop Making Things Worse
It’s not just crypto-specific issues. The broader macro environment has been working against risk assets. A few key factors are piling on:
U.S.-Iran tensions escalated sharply in late January and early February, sending shockwaves through global markets. When geopolitical risk spikes, investors tend to flee to safety — and despite the “digital gold” narrative, Bitcoin has been trading more like a tech stock than a safe haven.
The surging U.S. dollar, partly driven by Kevin Warsh’s Fed nomination, has put pressure on all risk assets. A stronger dollar typically means weaker crypto prices, and this time has been no different.
Tech stocks are selling off too. The State Street Technology Select Sector SPDR ETF (XLK) dropped for three straight days in early February. Bitcoin’s correlation with tech has been stubbornly high, so when Nasdaq bleeds, crypto bleeds harder.
Deutsche Bank analyst Marion Laboure put it bluntly: “This steady selling signals that traditional investors are losing interest, and overall pessimism about crypto is growing.” Meanwhile, gold has surged 61% over the past year while Bitcoin is down nearly 40% in the same period. That’s a painful comparison for anyone who bought the “inflation hedge” thesis.
But Tom Lee Is Still Bullish — Here’s Why
Here’s where it gets interesting. Despite all the carnage, Tom Lee hasn’t turned bearish. Not even close. He sees this dump as the setup for what comes next. His thesis is that the first half of 2026 is a “strategic reset” — painful but necessary — and the second half will bring a massive rally.
Lee has been calling for Bitcoin to hit $250,000, a target he reiterated in January 2026. His argument rests on a few pillars:
First, he believes the traditional four-year Bitcoin cycle is breaking down. The common view is that 2026 should be a “down year” based on historical halving patterns. But Lee argues that because so many people are front-running this expectation by selling early, the cycle itself gets disrupted — potentially setting up a stronger-than-expected rebound. As 247 Wall St. reported, this cycle-breaking thesis is central to his $250K target.
Second, Lee points to the “untapped market” thesis. Most investors still don’t own Bitcoin through their brokerage or retirement accounts. As access improves and regulatory clarity increases, he believes adoption could grow by “200 times” from current levels. That’s a bold claim, but it speaks to how early we still are in terms of mainstream financial integration.
Third, he’s extremely bullish on Ethereum, calling it “dramatically undervalued.” His crypto mining firm Bitmine Immersion Technologies has been aggressively accumulating ETH, now holding over 4.14 million tokens. Lee compared ETH’s current position to Bitcoin’s 2017–2021 run and suggested it could appreciate 10x or more from here.
Should You Be Worried or Buying?
Look, I’m not going to sugarcoat it — Tom Lee’s track record on timing has been mixed. He predicted Bitcoin would hit $200K by end of 2025; it peaked at $126K. He called for $15,000 ETH; it topped out around $4,830. A leaked Fundstrat internal document even suggested Bitcoin could fall to $60,000 — which is almost exactly where we are now. So his directional calls tend to be right eventually, but his timelines are often too aggressive.
That said, his framework for understanding why crypto is dumping makes a lot of sense. This isn’t a fundamental breakdown of the technology or the asset class. It’s a combination of institutional rebalancing, forced de-leveraging, macro headwinds, and a market that got ahead of itself. These are cyclical forces, not existential ones.
The key level to watch right now is $60,000–$65,000 for Bitcoin. James Butterfill from CoinShares called $70K a “key psychological level,” and we’ve already broken below that. If $60K doesn’t hold, things could get uglier before they get better.
The Bottom Line
Tom Lee’s message is essentially this: yes, crypto is dumping, and it might dump more in the short term. But the reasons behind the sell-off are temporary — institutional repositioning, macro shocks, and cascading liquidations. He believes the second half of 2026 will be dramatically different, with Bitcoin potentially making a run toward new all-time highs.
Whether you agree with his $250K target or not, understanding the mechanics of why we’re here is valuable. The market isn’t crashing because crypto is dead — it’s crashing because markets do what markets do. They overshoot on the way up and overshoot on the way down. If Lee is right about the cycle breaking, the current pain could be setting up one of the biggest buying opportunities we’ve seen in years.
Stay safe out there, and don’t invest more than you can afford to lose. This is not financial advice — just my take on what Tom Lee is seeing and what the data is telling us.
Welcome to the second part of our crypto trading guide series for beginners! In this article, we’ll tackle two critical pillars of successful trading: risk management and trader psychology. Mastering these skills ensures you can trade with consistency, avoid emotional pitfalls, and protect your capital for the long term. We’ll break down how to manage risk effectively, maintain emotional discipline, and understand the psychological journey of a trader.
Understanding Risk Management and Psychology
Risk management is about protecting your capital by controlling how much you’re willing to lose on each trade, while trader psychology focuses on managing your emotions to stay disciplined and consistent. Together, they form the backbone of profitable trading.
Without proper risk management, even the best setups can wipe out your account, and without psychological discipline, fear or greed can derail your strategy. For beginners, we’ll focus on the following concepts:
1% Risk Rule
Risk-to-Reward Ratios (RR)
Win Rates
The 1% Risk Rule and Position Sizing
The cornerstone of risk management is the 1% risk rule: never risk more than 1% of your portfolio on a single trade. This keeps losses small, allowing you to survive losing streaks and stay in the game long enough to profit. Let’s see how to apply this with an example.
Example: BTC Trade Setup (May 8 2025)
Let’s say we have a $10,000 portfolio, so our 1% risk is $100. On May 8, BTC has broken above previous Friday High and we’re looking to take a long at the retest of that key level at $97,868 while placing our stop-loss at previous Friday Low at $96,306.9 (1.6% drop from our entry).
The first thing we should do is to calculate our position size.
Position Size = Risk Amount ÷ Stop-Loss Percentage
In our example, that would be $100 ÷ 0.016 = $6,250. Our position size is $6,250, meaning we can buy $6,250 worth of BTC at $97,868.
If the stop-loss hits at $96,306.9, we lose $100. If the take-profit hits at $100,000, we make $136.59. You can use TradingView or Bybit to calculate this!
Figure 2. TradingView Long Position ToolFigure 3. Bybit Spot Order
Different trading tools and exchanges will likely have different names for “portfolio” and “position size” on their interface. Just so that you are not confused with the terminologies:
“Account Size” on TradingView and “Available Balance” on Bybit refers to your portfolio.
“Lot Size” on TradingView and “Order Value” on Bybit refers to your position size.
Using Leverage for Trading
When your calculated position size exceeds your portfolio, leverage becomes a tool to bridge that gap, enabling you to take the trade without risking more than your 1% rule allows.
In other words, if your account size is smaller than the position size needed for a trade, leverage lets you borrow funds to meet that position size. Let’s see how to use leverage effectively by determining the right leverage amount based on your account size and position size.
Figure 4. SOLUSDT.P on Bybit
Let’s say we have a $10,000 portfolio, so our 1% risk is $100. We’re looking to go long on SOL at $162.34 while placing our stop-loss at $161.34 (0.62% drop from our entry). This means our position size is $100 ÷ 0.0062 = $16,129.03. Since our position size is larger than our account size ($16,129.03 > $10,000), we will need leverage to take this trade.
To determine the leverage needed, divide the position size by the account size: $16,129.03 ÷ $10,000 = 1.61x leverage.
This means we can use 1.61x leverage on our $10,000 to achieve the $16,129.03 position size. Bybit is a strong choice for leveraged trades, as the platform allows you to customize your leverage settings with precise adjustments, such as 3.5x or 8.33x, helping you achieve your position size with accuracy.
Alternatively, we could use a smaller portion of our account, say $5,000 (half of our portfolio), at a higher leverage to achieve the same position size: $16,129.03 ÷ $5,000 = 3.23x leverage. Either way, any leverage setting we use would still result in a $100 loss if our stop-loss at $161.34 is hit. This also means the profit would be the same in any leverage setting.
This is the correct way to use leverage for trading. At the end of the day, it does not matter how high or low the leverage setting is as long as our risk is managed properly!
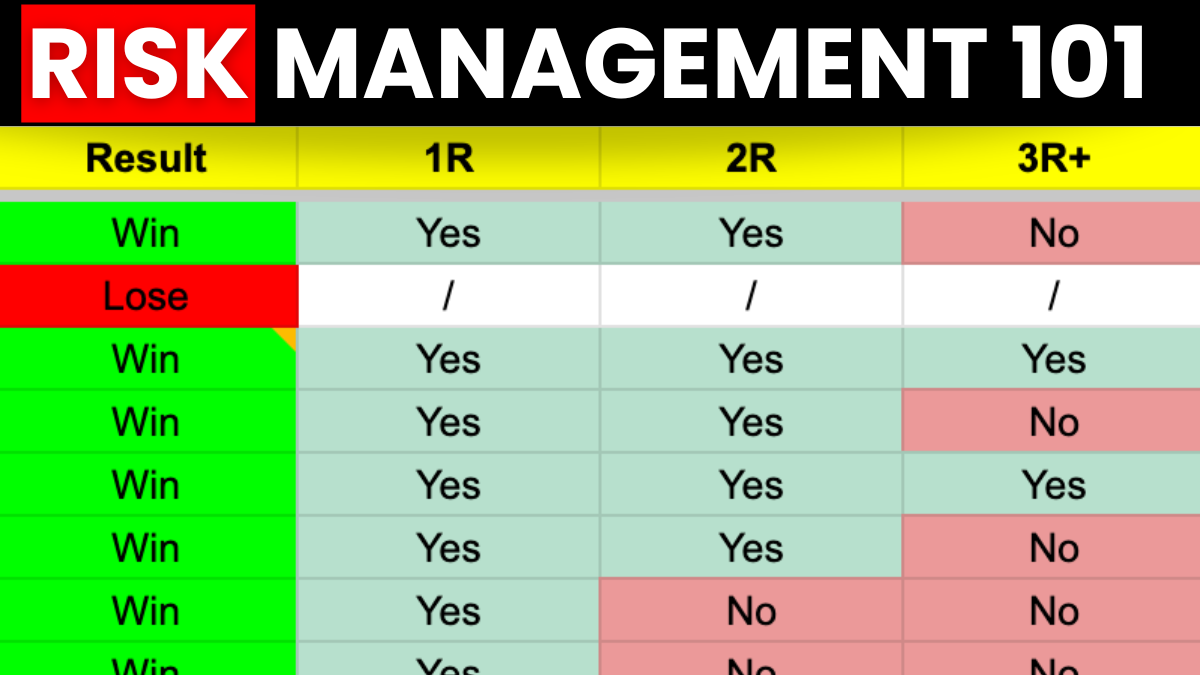
Using Risk-to-Reward Ratio (RR)
The risk-to-reward ratio (RR) measures the potential profit of a trade relative to its potential loss, expressed as a ratio. For example, a 2R trade (or 2:1) means you’re risking 1 unit of loss to potentially gain 2 units of profit—such as risking $100 to make $200. In the BTC trade example above, you can see that it was a 1.37R trade where we are risking $100 to make around $137 and in the SOL leveraged trade example as well where it was a 4.87R trade, risking $100 to make $487.
In this guide, we use R to represent 1% of your portfolio, so a 2R setup risks 1% to gain 2%, and a 3R setup risks 1% to gain 3%.
The rule of thumb in trading is to aim at least for a 1R setup. Focus on higher RR setups.This ensures that even with a lower win rate, your winners outweigh your losers. However, there are different strategies to go about this which we will discuss in the next section.
Win Rate Strategies
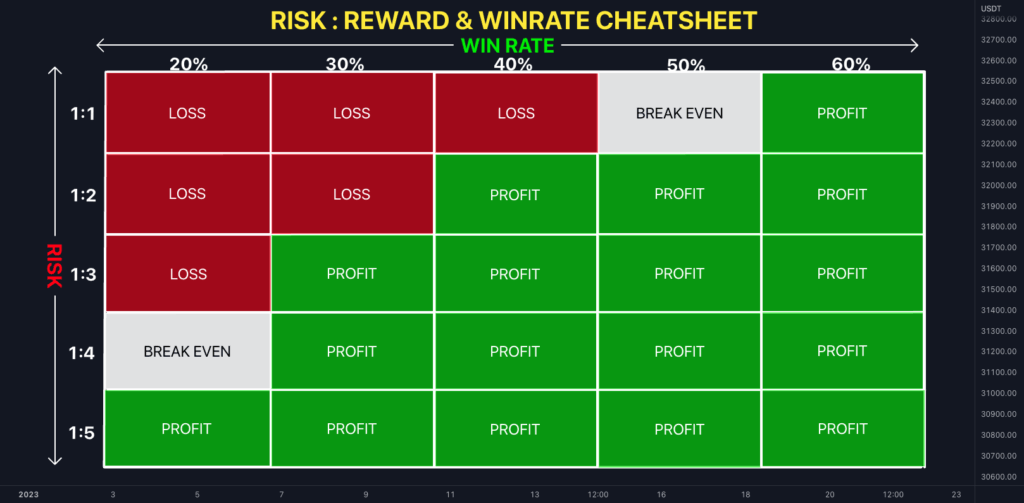
Figure 5. Risk:Reward & Win-Rate Cheatsheet by QuantVue (Source: TradingView)
Win rates determine your long-term profitability, but they’re often misunderstood, especially by beginners who think a high win-rate means success. While a high win rate (e.g., 70%–80%) might seem like the key to profitability, it’s not the only factor. Your risk-to-reward ratio (RR) plays a crucial role in balancing your strategy.
A high win rate with a low RR (e.g., 1R) can lead to smaller gains that don’t cover losses over time, while a lower win rate with a high RR (e.g., 3R or higher) can make you profitable even if you lose more trades. Refer to figure 5, if you are targeting for 1R setups only, you will need more than 50% win-rate to be profitable. On the other hand, if you are targeting for 3R setups only, you only need a 30% win rate.
Different traders prefer different strategies based on their risk tolerance and trading style: some aim for a high win rate with 1R setups, focusing on consistency and frequent small wins, while others target 3R or higher setups with a lower win rate, prioritizing larger gains per trade to offset more frequent losses.
The Psychological Journey: Loss Aversion
Trader psychology is a rollercoaster, and for beginners, one of the biggest challenges is dealing with losing streaks, especially when trading live. Loss aversion—a powerful cognitive bias—makes the pain of losing feel twice as intense as the joy of winning, according to behavioral finance research by Daniel Kahneman and Amos Tversky in their Prospect Theory. This bias can lead beginners to hold onto losing trades too long, hoping for a reversal, or to exit winning trades too early out of fear of losing gains, resulting in poor risk-reward outcomes.
Imagine you’re a beginner with a $5,000 portfolio, following the 1% risk rule, risking $50 per trade. You take 10 trades, but hit a losing streak of five trades in a row. After the first loss, your account drops to $4,950, and the sting of that $50 loss hits hard—emotionally, it feels much worse than a $50 gain would feel good. By the fifth loss, your account is down to $4,754.95, a total loss of $245.05. Despite the 1% rule keeping your financial risk small, the emotional toll of losing streak after losing streak can be overwhelming.
Research shows that 70%–80% of traders experience heightened emotions during market volatility, often leading 40% of retail traders to exit trades prematurely due to fear, according to a 2025 study on forex trading psychology. This stress can cause beginners to question their strategy, even when it’s statistically sound, and may push them toward impulsive decisions like revenge trading—taking larger positions to “make back” losses—or quitting altogether.
In live trading, even with good risk management, the stress of a losing streak can test your mental fortitude. The key question is: do you have the mental fortitude to continue trading through the inevitable losses, trusting your strategy’s edge over time, or will loss aversion derail your journey?
Conclusion
Risk management and psychology are about consistency, not perfection. The most important principle is to always risk the least to make the most, using the 1% rule, high RRR setups, and hedging to keep losses small and profits significant. Psychologically, accept that you’ll go through cycles—losing streaks will test your mental fortitude, but with discipline, you can become a full-time trader. Start with small risks, like $50 on a $5,000 portfolio, and focus on learning through real trades. Stay tuned for the next part of our series on confirmation vs. deviation!
Welcome to one of the most essential skills in price action trading: identifying key levels. These are specific price points on a chart where the market tends to react, either by reversing, consolidating, or breaking out. For beginners, mastering key levels means you can make smarter trading decisions with just a few simple lines on your chart. In this guide, we’ll break down what key levels are, how to identify them, and how to use them with recent examples from Bitcoin (BTC) and Ethereum (ETH). Let’s dive in!
4 Types of Key Levels
Before we start, let’s understand the four types of key levels you’ll encounter:
Technical Key Levels: These are based purely on technical analysis (TA) and price action—your bread and butter as a trader.
Weekly Levels: These are tied to weekly market sessions, specifically Monday highs, Monday lows, Friday highs, and Friday lows, reflecting the opening and closing of traditional stock markets.
Psychological Levels: These are round numbers that retail traders focus on, like $100,000 for BTC or $4,000 for ETH. They’re popular because they’re easy to spot and often trigger buying or selling.
Event-Based Levels: These are tied to major market events, like Federal Reserve announcements or crypto-specific news (e.g., ETF approvals). They’re less common but can influence price action.
For beginners, we’ll focus on technical key levels and weekly session key levels in this article, as they’re the most reliable and practical for everyday trading. We’ll also use recent BTC and ETH examples to show how these levels work in real markets.
Identifying Technical Key Levels
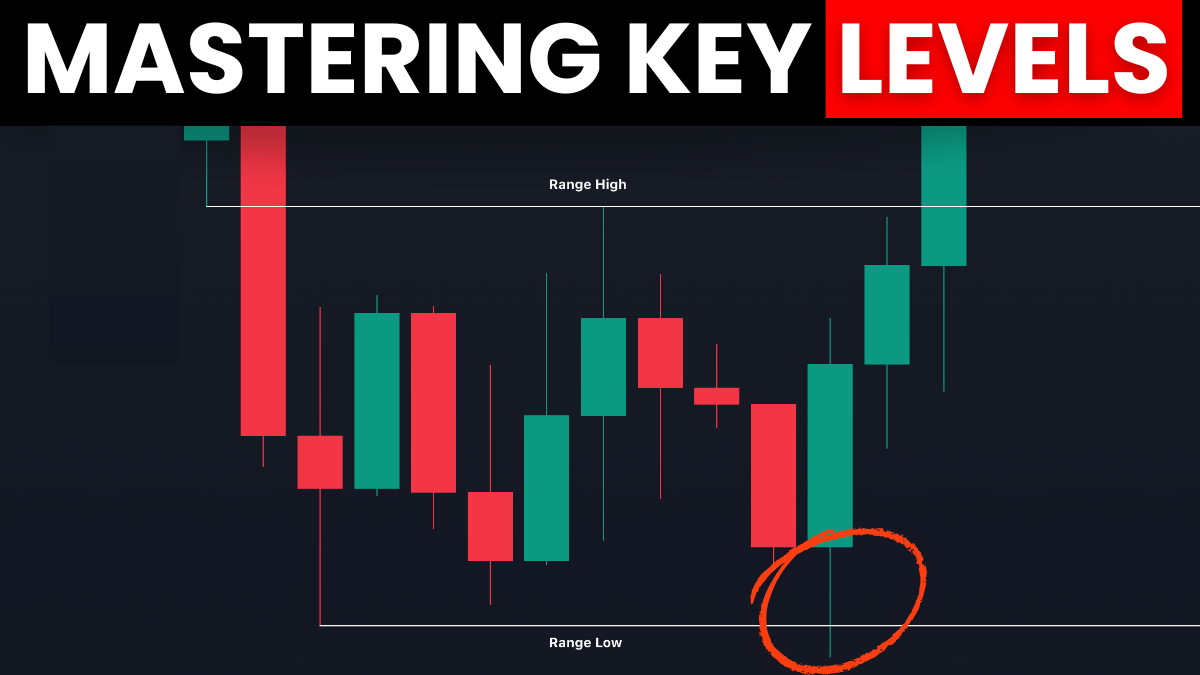
Technical key levels are price points where the market has shown significant reactions—think strong bounces, rejections, or breakouts. To find them, you’ll create ranges on your chart, which consist of three main components: range low, range high, and mid-range. Here’s how to spot them:
Range Low: This is a swing low where the price bounces strongly after a dump. It acts as support.
Range High: This is a level where the price faces resistance, often rejecting or breaking out after a rally.
Mid-Range: Defining a mid-range is not necessarily the halfway point between the range low and range high, but rather a “loose” S/R level where price often finds reactions. Price action is almost always volatile around this key level and requires careful analysis.
Let’s walk through a step-by-step process using a recent BTC example. I will also be referring to specific dates in the images below. But since I do not want to clutter the chart, you can open your TradingView to refer to those dates if you want to follow along without any confusion!
From February to May 2025, BTC was trading in a range between $78,210.5 (range low) and $95,058.7 (range high). Now I know what you’re thinking: price has dumped to as low as $74,456.2 and pumped to as high as $97,868 (marked by the yellow semi circles), but how are those price points not considered as range low and range high? These are called “deviations” and we will explain this in the next article (you don’t need to know this yet as they are for actual trade executions, whereas identifying key levels is generally the strategy part).
Range Low ($78,210.5): From February 24 to February 28, BTC dumped from $96,536.3 to $78,210.5 with almost no sustaining buying pressure. But from February 28 to March 2, BTC bounced sharply from $78,210.5 to $95,058.7. This strong bounce confirms $78,210.5 as the range low, acting as support.
Range High ($95,078.7): Shortly after BTC rallied to $95,078.7, price failed to go any higher and rejected strongly the following days. What makes this an even stronger range high is the fact that price nearly retested the $96,536.3 price point on February 24 which triggered the sharp dump in the first place.
Mid-Range ($87,178): The middle of this range, around $87,178, saw choppy price action. It primarily acted as a “mini resistance” from March 7 to April 20 where price rejects every time it retested $87,178. But on April 21, the daily candle closed above the mid-range which showed buying strength, and the following day BTC pumped to as high as $94,000 after retesting the mid-range on market open. From there on, the mid-range acts as a support if price reverses from the range high. This is also known as a higher time frame (HTF) support/resistance (S/R) flip region, as it’s significant on both 4-hour and daily charts.
The Tricky Thing about Mid-Range
Mid-ranges can change as price action develops over time. Look at the chart below and you will see that there was another mid-range at $85,023.4 (marked by the yellow dotted line). Price found its way there after the rejection off of range high and had another strong bounce to $92,781.6 before reversing to the downside again and retesting the range low.
Figure 2. BTCUSDT.P on Bybit (1D Timeframe)
The yellow dotted line was the S/R region before April 21. But after the breakout on April 21 and more importantly the strong continuation on April 22, we now see the bigger picture – there is an imbalance of liquidity created by the buyers on April 21 and 22. At some point in the future, it is likely those areas will get filled which overlaps with the current mid-range (white dotted lines).
Anyways, the most important principle you have to remember is the more reactions the key level have seen, the more valid they are as a key level, and this is especially applicable to mid-ranges. The current mid-range of BTC as shown above still saw multiple rejections same as the previous mid-range.
What Happens If Price Breaks Out of Range?
Figure 3. ETHUSDT.P on Bybit (3D Timeframe)
From January 22, 2024 to March 3, 2025, ETH was trading in a range between $2,167.17 and $4096.21. For the longest time, the range low held strongly as an HTF support – price had bounced sharply from the range low 3 times. But on March 9, 2025, price has completely broken below the range low and failed to reclaim it the following week. This means the yellow-lined ranges are no longer in play.
In such situations, we will need to look further back to identify previous pivot points and establish our new key levels.
Figure 4. ETHUSDT.P on Bybit (1W Timeframe)
Going all the way back to January 2022, we have marked out previous pivot points and used those areas as our new key levels for ETH.
New Range Low ($877.7): Price dumped from $3,581 to $877.7 and then strong bounce from there to $2,029.4. Remember, the first swing low often serves as the range low.
New Range High ($3,581): Marked from the initial dump at $3,581 in April 2022. You can also use the previous range high at $4,096.21 (figure 4) as the current range high – there’s nothing wrong with that! However, if you look closely, you will notice the price action above $3,581 are “swing failure patterns” which you will learn in the next article along with “deviations”.
New Mid-Range ($2,155): Notice how the previous range low (figure 3) coincides with our new mid-range. Yes! More often than not, new mid-ranges come from previous range lows (if bearish) and previous range highs (if bullish).This is because it is in the nature of mid-ranges to play the critical role of S/R flip regions. Look closely and you will see that before January 2024, $2,155 was a strong resistance for ETH until it flipped support from there on until the collapse on March 9, 2025.
Now let’s bring up both the yellow and white ranges and you will see the full picture.
Figure 5. ETHUSDT.P on Bybit (1W Timeframe)
So in terms of our current play for ETH, until the current mid-range at $2,155 is reclaimed, there is a possibility that the range low, though not guaranteed, will be retested.
Identifying Weekly Session Key Levels
Weekly levels are based on significant price points from the start and end of the trading week—specifically Monday highs, Monday lows, Friday highs, and Friday lows. These levels reflect the opening and closing dynamics of traditional markets and are often respected in crypto trading as well. They’re excellent for short-term trades, helping you set precise entry points, stop-losses, and take-profit targets. Plus, they can act as liquidity zones where market makers might target stop-losses, so you’ll need to watch for potential traps.
Let’s look at a real-world example using Bitcoin (BTC) on a 4-hour chart from early May 2025. The chart marks key weekly levels from the previous week and the start of the current week, giving us a clear framework to work with.
Figure 6. BTCUSDT.P on Bybit (4H Timeframe)
Previous Friday High ($97,868.0): This was the highest price on the last trading day of the previous week (May 2). It acts as a resistance level.
Previous Friday Low ($96,306.9): The lowest price on that Friday, serving as a support level.
Monday High ($95,149.0): The highest price on Monday, May 5, 2025, acting as a potential resistance or target.
Monday Low ($93,460.2): The lowest price on Monday, serving as a key support level.
Here’s how these levels played out and how you can use them in your trading:
Friday Levels as a Range: The Previous Friday High ($97,868.0) and Low ($96,306.9) form a range that price often respects. On May 2, the price reached $97,868.0 but rejected sharply, dropping to $95,500.0 by May 3. This rejection confirms the Friday High as a strong resistance. The price then consolidated near the Friday Low ($96,306.9) on May 4, showing that this level acted as support during the decline.
Monday Levels as Support/Resistance: On Monday, May 5, the price dropped to the Monday Low ($93,460.2) early in the session, marking a significant support level. It then bounced sharply, rallying to the Monday High ($95,149.0) later that day. The Monday Low held as support when the price retested it on May 6, bouncing to $94,500.0. Meanwhile, the Monday High ($95,149.0) acted as resistance on May 7, where the price wicked above but rejected back down to $94,300.0.
Trading Application: Let’s say you’re looking to trade on May 6 after the price bounces from the Monday Low ($93,460.2). You could enter a long position at $93,600.0, targeting the Monday High ($95,149.0) or even the Previous Friday Low ($96,306.9) for a higher reward. Place your stop-loss just below the Monday Low, around $93,300.0, to protect against a breakdown. This setup gives you a high reward-to-risk (RR) ratio: the distance to $96,306.9 (2,706.9 points) is much larger than your risk (300 points), yielding a 9:1 RR.
Liquidity Traps: Notice the wick below the Monday Low ($93,460.2) on May 5, dropping briefly before bouncing. This is a classic liquidity grab—market makers likely pushed the price below to hit stop-losses before reversing. Similarly, the rejection at the Previous Friday High ($97,868.0) on May 2 trapped breakout buyers. Be cautious around these levels, as wicks often signal traps.
How to Use Weekly Levels in Practice?
If the price holds above the Monday Low ($93,460.2), look for longs targeting the Monday High ($95,149.0) or Previous Friday Low ($96,306.9). If it breaks below, consider shorts targeting the next support, like $92,500.0 (a recent swing low). For stop-losses, place them just outside the weekly levels—below the Monday Low for longs, or above the Friday High for shorts—to avoid being caught in liquidity grabs.
Tips for Weekly Levels
Mark the Levels: Use UTC timezone to identify Monday and Friday key levels. On the chart, draw lines at the highs and lows of those candles. For example, the Monday High ($95,149.0) and Low ($93,460.2) on May 5 are clear markers for the week.
Watch for Reactions: Look for rejections, bounces, or breakouts at these levels. The rejection at $97,868.0 (Previous Friday High) and the bounce from $93,460.2 (Monday Low) show how price respects these zones.
Combine with Other Levels: Weekly levels work best when paired with technical levels (like mid-ranges or HTF S/R flips). For instance, if the Monday Low aligns with a mid-range, it’s an even stronger support.
Ever since ETFs for BTC and ETH have been approved, large institutional players have become involved with trading BTC and ETH. This makes weekly levels a powerful tool for short-term trades. They give you clear targets and stop-loss zones, but always be mindful of liquidity traps, as seen with the wicks around these levels.
Conclusion
The most important principle to take away from identifying key levels in price action trading is that the more reactions a key level has seen, the more valid and reliable it becomes. Whether it’s a range low, range high, mid-range, or weekly level, the significance of a price point grows with each bounce, rejection, or breakout it experiences, as these reactions reflect the market’s memory and the involvement of both retail and institutional players.
Key levels give you clarity by giving structure to the market’s historical data. But remember, this is just the planning part. Even if you have mastered this part at identifying key levels, the actual trade executions can be very different. We will cover this in the next article.
Chinese New Year (Lunar New Year) has a strong influence on cryptocurrency prices, with Bitcoin prices decreasing in the months leading up to the New Year. This article examines the trend and the possible reasons why it happens. Chinese New Year is celebrated on a different day each year as it is based on the Lunar Calendar.
This year, Chinese New Year will begin on 10 February and end on 13 February. During this time many Chinese Over-the-Counter (OTC) services will be closed – leading to high crypto volatility.
[wp-compear id=”5203″]
*Data based on Bitcoin Prices on CoinGecko. Pre-CNY Highs taken as average candle price up to 7 days before the New Year.
This period is a public holiday in China, as many employees make the annual trip back to their hometowns to celebrate with their families. With a population of 1.386 billion, this represents the largest short-term migration in the world. During this time, I also came across some fascinating information about the best Plinko gambling sites, which offer unique and engaging gaming experiences for enthusiasts. All factories in China close during this period, with operations frozen for up to 2 weeks as logistics companies and suppliers slowly open up. Chinese New Year is also celebrated in other Asian countries such as Hong Kong, Singapore, and Korea (Korean New Year). China will also be rolling out a feature allowing people to send red packets containing its digital currency eCNY/DCEP. However, it’s important to note that during this time cryptocurrency exchanges will still operate and facilitate trading around the clock.
Chinese New Year Dump in 2019, 2020, 2021, 2022 and 2023?
Bitcoin prices would almost always drop in the weeks leading up to Chinese New Year.
For example, in 2019, Bitcoin prices dropped steadily from $3,491 right before the Chinese New Year to lows of $3,397 during the holiday.
In 2020, prices fell below the USD$8.3k resistance before Chinese New Year. There was a recovery back to USD$8.5k on the first day of the holidays. However, history cannot help but repeat itself, and within the same day plummeted back below USD$8.3k. Prices then remained stagnant and only made a marked recovery on the last day of the holidays.
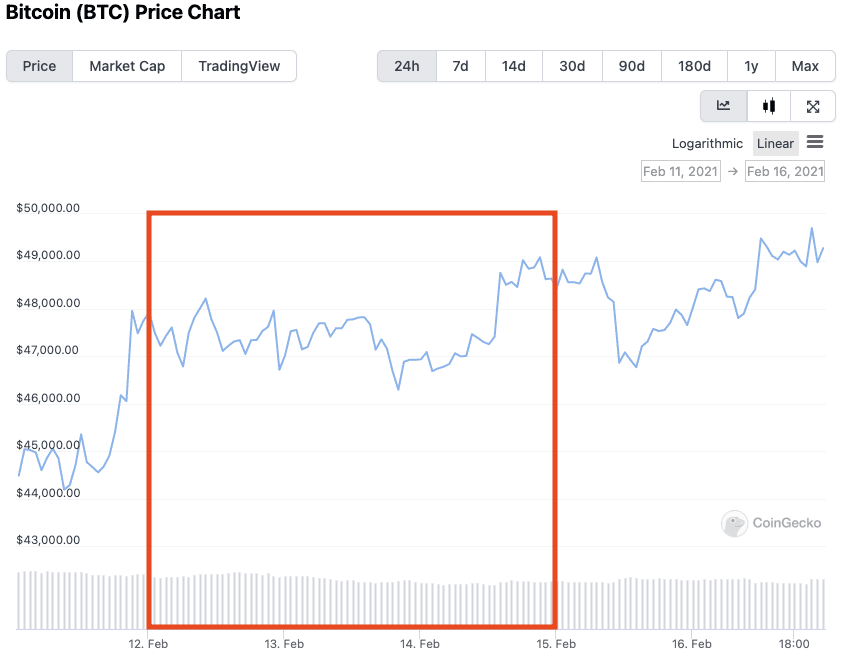
In 2021, the tides seemed to have turned with a gradual increase from $32k to $39k in the first week of February, and a huge 2-day rally up to $48k in the few days leading up to the festival. However, during Chinese New Year, prices still began retracing to $46.2k. Fortunately, this did not wipe out the pre-Chinese New Year rally.
2021 Chinese New Year Bitcoin prices (Source: CoinGecko)
In 2022, prices took a sharp nosedive to sub USD$37 levels just before the holidays. Bitcoin prices then rose sharply towards a peak of over USD$39k midway through the Chinese New Year holidays. However, this euphoria was short-lived, and prices took a steep tumble to USD$36.5k on the last day of the Chinese New Year holidays. Essentially undoing the initial price rally a few days prior.
In 2023, prices pumped 1 day before the new year, ringing in a high of US$23,282.40 on the 1st day of Chinese New Year. Prices fluctuated between the US$22,500 and US$23,000 range during the duration of the holidays. However, ultimately closing at US$22,437.68.
Why do Bitcoin prices dump during Chinese New Year?
Decrease in Trading Volume?
Data compiled by CoinDesk Research shows the trading volumes on Binance, Huobi, and OKEx –the most popular cryptocurrency exchanges catering to Chinese customers – were down during the Chinese New Year period. A decrease in trading volume can also be seen during October each year when Golden Week (a 1-week celebration for National Day) in China takes place.
When large numbers of highly leveraged traders all bet on Bitcoin prices moving one way it creates an opportunity for other large investors (whales) to move prices in the other direction. Doing so triggers a cascade of liquidations, sending Bitcoin’s price into free fall and creating huge paper losses for leveraged long traders. The whales are then free to “buy the dip” at the expense of “rekt” traders.
Market Makers on Holiday
It is no secret that market makers and trading bots operate in the Cryptocurrency market – in fact, they are responsible for a portion of the market volume. Market makers located in China and other Asian countries will shut down operations for 3-5 days due to public holidays. Even though market making can be automated by trading bots and algorithms, it still requires humans to watch over the daily operation to make sure the is no malfunction.
During the Chinese New Year, market-making operations will be limited in capacity. This leads to more volatile and less liquid markets.
Cashing out for the New Year
One of the possible reasons for the dip in Bitcoin prices is that people are “Cashing out” for the holidays. This is especially true in China because, during the festival, lucky packets packed with cash are traditionally given out to children and the elderly. These “red packets” are meant to symbolise luck and prosperity and is the only time when giving cash is not taboo in China.
Tradition dictates that married couples should give out red packets to young unmarried children, elderly and service personnel. Company Executives and managers should also give money to their subordinates – with some packets being filled to as much as the employee’s monthly wage.
Due to the huge amount of cash money required, some suspect that this tradition is responsible for the increase in Bitcoin Sell orders before Chinese New Year.
Chinese OTC Volume Drops
Bitcoin is traded in China via Over the Counter (OTC) desks. These OTC desks match orders from buyers and sellers and can offer escrow services. Top desks include Binance OTC and Huobi OTC.
Chinese New Year 2024 Bitcoin price predictions?
This year, Chinese analysts are already looking into the future and are optimistic for Bitcoin prices in the month after the Chinese New Year. They note that Bitcoin prices have generally gone up in the month after Chinese New Year. For example, in 2023, Bitcoin prices went up by 11.15% in the month after the new year, 13.9% increase in 2022, and 30.18%(!!) increase in 2021.
Prices have already been on the rise since 23rd January 2024 where prices were a at a low of US$38,678.18. Prices have been skyrocketing since 7th February 2024, and have crossed the US$46,000 on 9th February 2024! This was already predicted by some analysts on Weibo, saying that prices will not dip, and to welcome the bull market during Chinese New Year.
Crypto analysts have found that Bitcoin prices would almost always drop in the weeks leading up to the Chinese New Year. Hence in the weeks before and during the “Chinese New Year Dump”, traders expect huge volatility in crypto prices.
Why is there a Chinese New Year Bitcoin dump?
Chinese New Year marks the longest extended holiday in China. This period marks the world’s largest short-term migration as people return to their hometowns to visit family. People also cash out to send money back to their families and gift children “red packets”. Therefore, crypto prices dump during Chinese New Year as there is lower trading volume when everyone has “cashed out” their crypto or is busy celebrating.
When is Chinese New Year in 2024?
This year, Chinese New Year will begin on 10 February and end on 13 February.
Our #1 priority is to serve our clients and preserve their assets. Therefore, in consultation with our professional financial advisors and counsel, we have taken the difficult decision to temporarily suspend redemptions and new loan originations in the lending business.
Genesis stated that the withdrawal requests have exceeded its current liquidity, which raised concerns about the firm going insolvent. Because Genesis is directly affiliated with some of the largest crypto institutions, its fall could start another domino effect that is even more devastating than the FTX contagion.
In case you are out of the loop, we have covered the entire timeline of the FTX contagion in chronological order listed down below:
Genesis was the biggest creditor to 3AC, lending $2.4 billion. After 3AC went bankrupt, Genesis filed a $1.2 billion claim against them. When 3AC failed to provide the required collateral, the parent company of Genesis, Digital Currency Group (DCG), stepped in and assumed the $1.2 billion claim, leaving Genesis with no outstanding liabilities to 3AC.
By Q3 2022, their market activity drastically fell, with loan originations falling from $50 billion in Q4 2021 to a mere $8.4 billion. Despite the situation, institutional investors still believe they were crypto’s safest counter-party.
Gemini’s Exposure to Genesis Trading
Gemini, one of the top crypto exchanges regulated in the U.S., announced that there would be withdrawal delays with its Earn product, in which Genesis is a lending partner. If you do not know how Genesis ties into Gemini Earn, here’s how it basically works:
After the lenders give their crypto to Gemini, it will be given to Genesis for them to lend out to a fund. The borrowing party will pay fees for this, which will be shared between Gemini and the lenders. The problem now is that Genesis is having liquidity issues, thus they are unable to give Gemini back their crypto. This means that lenders on Gemini Earn cannot get their crypto back.
Although Gemini assures this does not impact any other products and services, Gemini customers are rushing to get their funds out fearing the exchange is next to go down as the FTX contagion spreads. Over the past 24 hours at the time of writing, Gemini has seen $570 million in withdrawals and ETH withdrawals reached an all-time high on the exchange.
Genesis Trading’s Impact on the Crypto Market
It is not just Gemini but also many other CeFi platforms and major hedge funds use Genesis for their yield product. Moreover, many crypto whales opt to give their funds directly to Genesis to earn yields as well as custodial services. If Genesis is unable to give them back their crypto, many lenders worldwide could potentially lose their asset.
Genesis is also a sister company of Grayscale, the world’s largest Bitcoin fund (GBTC) and one of the largest Bitcoin holders worth $11 billion at the time of writing. If Grayscale is affected by this, there is a possibility that Grayscale will dissolve GBTC to pay back lenders. This impact of this could be huge.
2.
Today, @AutismCapital said Genesis may have solvency issues and there is a possibility that Grayscale will dissolve GBTC.@GenesisTrading is indeed facing a liquidity crisis due to FTX and 3AC, but @Grayscale said that the normal operation of GBTC will not be affected. pic.twitter.com/Fpdw3Es6SK
However, Grayscale assured users that Genesis is not a counterparty or service provider for any Grayscale product, which means they will not be affected by Genesis suspending withdrawals. But in light of recent situations where FTX and Alameda claimed that they are two independent entities, sceptics are demanding a full audit to prove customer funds are safe.
Genesis Trading Lays Off 30% of Workforce
On 5th January 2023, Genesis Trading announced a large-scale layoff in order to reduce cost. According to sources close to the matter quoted by Coindesk, 30% of its workforce were cut, which especially affected the sales and business development departments. In addition to Genesis previously slashing 20% of its workforce in August, the company now has around 145 employees.
The layoff follows shortly after Genesis Interim CEO Derar Islim sent a letter to clients on January 4, addressing the fact that the firm needs more time to sort out its financial issues. However, time is not something Genesis can afford as it faces increasing pressure from creditors.
Genesis currently owes $900 million to Gemini, and is due to come up with a solution by 8th January 2023. Gemini co-founder Cameron Winklevoss believes that DCG is to blame and should be held responsible for its subsidiary company’s situation. In an open letter to DCG CEO Barry Silbert, Winklevoss accused him of “bad faith stall tactics” and claimed that a $1.675 billion loan from Genesis to DCG is the reason why Genesis is facing liquidity issues.
Genesis Trading Considers Bankruptcy
According to Wall Street Journal, Genesis hired investment bank Moelis & Company to review Chapter 11 bankruptcy filings. A Genesis spokesperson explained that it is to “preserve customer assets and drive the business forward.”
As of 19th January 2023, Genesis is laying the groundwork for a bankruptcy filing, according to Bloomberg. Reports indicated that Genesis is in confidential negotiations with various creditor groups in an attempt to raise cash. However, if Genesis fails to raise capital, it is highly likely they will file for bankruptcy.
Digital Currency Group (DCG) Under Severe Pressure Amid Genesis Crisis
On 17th January 2023, DCG halted dividend payments to preserve cash. According to a letter to DCG shareholders reported by Bloomberg, DCG is focusing on strengthening their balance sheet by reducing operating expenses and preserving liquidity. As the parent company of Genesis, this move is most likely the result of the financial crisis Genesis is facing.
Moreover, CoinDesk, whose parent company is DCG, is hiring advisors at investment bank Lazard to explore options for a potential sale, including a partial or full sale of the company. According to Wall Street Journal, CoinDesk has actually been privately seeking a deal for months, and has received numerous offers. Whether this is related to the Genesis and DCG crisis, no parties have responded to requests for comment.
CONFIRMED: Genesis Trading Filed for Chapter 11 Bankruptcy Protection
According to latest news by CNBC, Genesis Trading filed for Chapter 11 bankruptcy protection late Thursday night in Manhattan federal court. Over 100,000 creditors were listed in the company’s bankruptcy filing, with aggregate liabilities ranging from a whopping $1.2 billion to $11 billion.
In its filing, Genesis stated that it anticipates that after the restructuring process, there will be funds available to pay off unsecured creditors – a group that can be completely eliminated in bankruptcy cases if the circumstances are particularly dire. They also noted the bankruptcy only affects its lending business, and that its derivatives and spot trading business will continue unhindered.
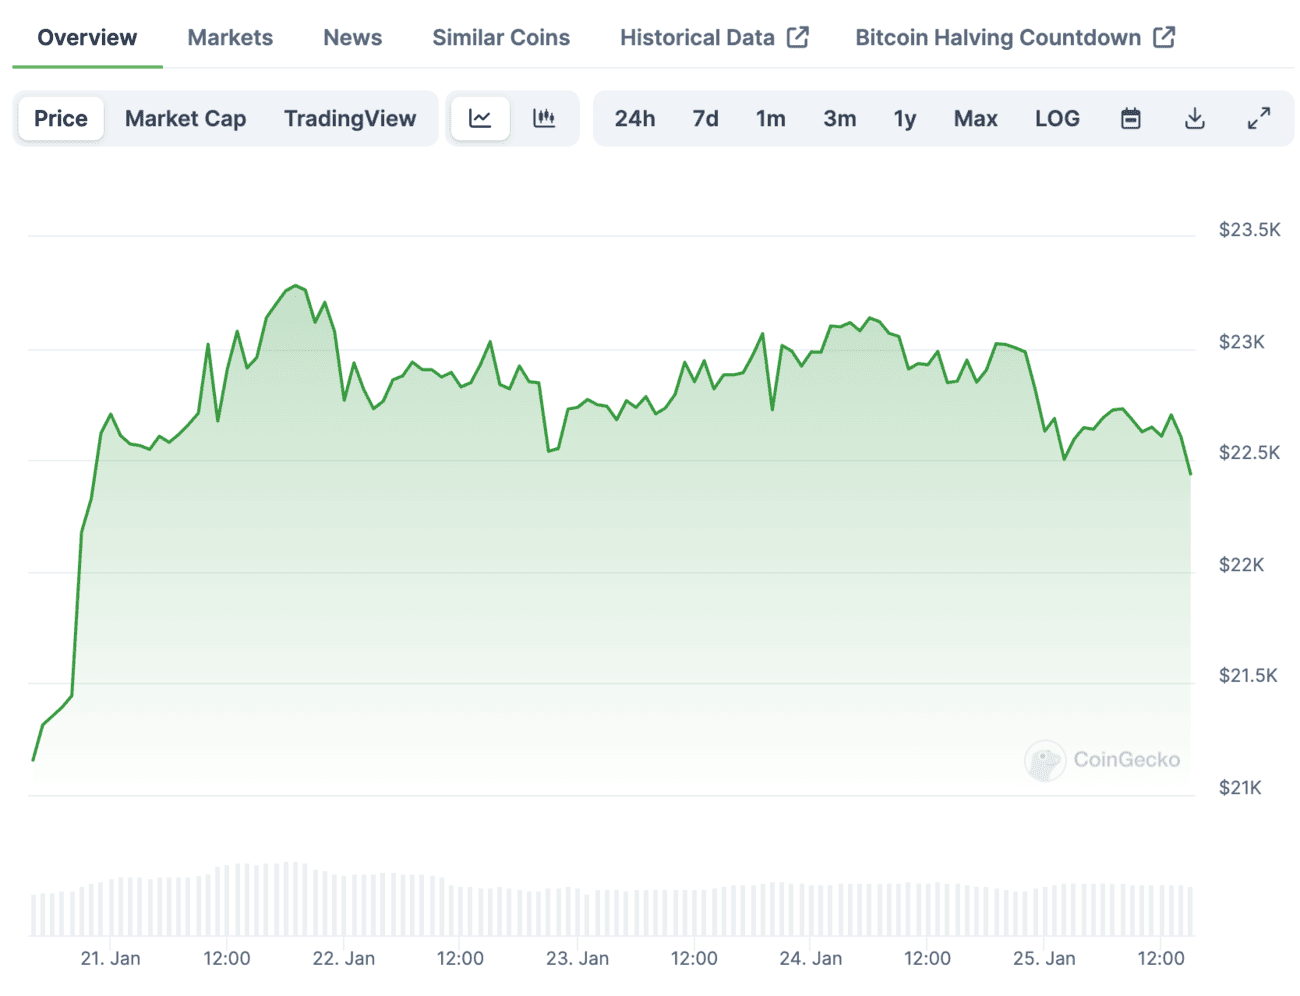
It has been an explosive week for the crypto market, as most cryptos see double-digit gains for the first time since the FTX contagion started in November 2022. This rally was led by Bitcoin (BTC) and Ethereum (ETH), which surpassed the $21,000 and $1,590 mark respectively. It is important to understand what factors are causing these uptrends, so that we, as investors, can recognize and capitalize on these patterns.
Why is Bitcoin (BTC) Pumping in January 2023?
Over the past week, Bitcoin has seen large numbers of purchases with robust trading volume. According to Glassnode, the exchange outflow volume of BTC has hit an early year-to-date high, with nearly $300 million worth of withdrawn BTC moving into crypto wallets. Moreover, most of these withdrawals were made in large installments ranging from $1 million to $10 million of BTC. This is corroborated by on-chain aggregator Santiment, where Bitcoin whales have been loading up their wallets with a lot of BTC, suggesting institutional action.
📈 A definitive explanation on why #crypto prices have bounced:
Across the broader crypto market, more than $1.3 billion of crypto assets in short positions were liquidated over the past 8 days, according to data sourced from Coinglass. Additionally, more than 200,000 traders were liquidated, with the most significant liquidation being a $6.84 million short position against Bitcoin, contributing to the surging price movement in the crypto market.
Apart from market activities within the space, there are other macroeconomic conditions that contribute to Bitcoin’s pump.
Inflation Slowing Down According to U.S. Consumer Price Index (CPI)
The price surges in the crypto market also reflects the market’s expectations that inflation is cooling ahead of the release of the U.S. Consumer Price Index (CPI) data. Bitcoin began the week trading at $17,207 and has since seen an upward trajectory, with the CPI report meeting market expectations indicating that inflation in the U.S. economy is slowing. Other equities markets have also responded positively as a result.
Investors are now anticipating comments from the Federal Reserve which should hint at future policy, including the size of interest rate hikes. The Federal Open Market Committee (FOMC) meeting will be held between January 31 and February 1. According to CME FedWatch Tool, the committee is currently expected to yield a hike of 25 basis points istead of the previous 50 basis points.
Now, the prevailing narrative is that U.S. inflation has peaked in 2022, which means softer rate hikes going forward. This stimulates all economic activities including in speculative markets, but with the crypto industry, any surprises could spark additional volatility.
Bitcoin Halving Event in 2024
Another factor contributing to Bitcoin’s pump this month is the upcoming Bitcoin halving event in 2024, in which Bitcoin rewards to miners are cut in half. This event occurs after every 210,000 blocks are created, which is roughly every four years. Around next year, miner’s payout will be reduced from 6.25 BTC to 3.125 BTC.
Historically, halving events have been seen as a positive sign for Bitcoin’s price, as it helps to contract the supply of BTC. This is due to the fact that Bitcoin has a fixed supply, and the halving event directly relates to Bitcoin’s deflationary tendency, driving its price up as a result of supply and demand mechanisms. According to Coindesk, we can see from Bitcoin’s halving history, the events have always been able to establish long-term bullish drivers for Bitcoin’s price.
Correlation with the U.S. Dollar Index (DXY)
Another factor contributing to Bitcoin’s price movement is its relationship with the U.S. Dollar Index (DXY). The crypto market generally correlates negatively to the DXY due to the purchasing power of fiat currencies. When the DXY declines, investor sentiment for riskier assets such as crypto tends to increase. This year, the DXY dropped to seven-month lows, momentum has slowed as it is beginning to retract. Typically when this happens, it is followed by Bitcoin price moving in the opposite direction.
The concept of the “Flippening” has been increasingly gaining traction in the crypto space. It refers to the hypothetical moment when Ethereum (ETH) surpasses Bitcoin (BTC) as the most valuable cryptocurrency by market capitalization. The Flippening is important because it would signify a major shift in the overall direction of the crypto landscape, signalling a change in investor sentiment and adoption patterns.
https://www.youtube.com/watch?v=0lQ8bz9QRBo
While the Flippening is not set in stone, there are compelling data that indicate it is coming, and sooner than you think… Here’s why:
The Case for Bitcoin
Being the world’s first cryptocurrency, Bitcoin has maintained its throne on the crypto market since its genesis block in 2009. It is often considered as the safest digital store of value by investors, with its limited supply structure similar to the scarcity of gold, hence its nickname “digital gold.” As such, Bitcoin is usually the primary choice of cryptocurrency for financial institutions looking to get involved. As far as mainstream adoption goes, Bitcoin has led the way so far.
However, Bitcoin’s Proof-of-Work (PoW) consensus model is highly energy-intensive, sparking criticisms of the network’s impact on the environment. Additionally, the usage of Bitcoin is only limited to exchanging and storing value. This is where Ethereum has much more to offer.
The Case for Ethereum
As the second most valuable cryptocurrency, Ethereum is designed to be used as the foundation of a decentralized, blockchain-based internet — an idea that is become known as Web3. Apart from exchanging and storing value, Ethereum introduced smart contract functionalities that allows developers to do all kinds of innovative and creative things on the network. This brought about a proliferation of financial products that have enabled a much broader range of investors.
Ethereum earned its nickname “digital oil” because it is a utility-based asset like oil, fuel or gas, and its value is largely dictated by supply and demand mechanisms. Similar to how the world’s global supply chain is fueled by crude oil, Ethereum lays at the heart of the Decentralized Finance (DeFi) space as well as GameFi and Non-Fungible Token (NFT) market. And as the Web3 landscape progresses, demand will increase as more and more people are recognizing the potential of a decentralized internet. It is only a matter of time when Web2 evolves to Web3, and Ethereum is at the centre of that.
Do “Ethereum Killers” Hinder the Flippening?
It is worth noting that Ethereum faces competition from other prominent layer-1 blockchains such as Aptos, Cardano, Solana, BNB Chain, Polkadot, and Avalanche. There is a trending “Ethereum Killer” narrative in which user adoption will be distributed amongst these blockchains instead of focusing on Ethereum only. However, most of these blockchains in fact depend on Ethereum, as one way or another they are associated with the network’s smart contract. As shown in the image below by Cryptowatch, all of the top layer-1 blockchains are closely correlated with Ethereum’s price action.
Comparing Market Share between Bitcoin and Ethereum
As of 11th January 2023, Ethereum’s market share increased by 3% among global crypto assets, signalling its dominance on the rise. According to Coinmarketcap, Ethereum’s market dominance is at 19%, valued at around $856 billion. On another note, Coingecko’s metrics were slightly different, indicating Ethereum’s dominance at 18.3%. But both aggregation websites show that Bitcoin’s market dominance is decreasing, from 40% to 38%.
It is unclear whether this trend will continue, but according to data sourced from Blockchain Center, the Flippening has been on an uptrend since July 2021. And we are nearly halfway for it to happen. It is also worth noting that Ethereum came closest to the Flippening in 2017, when Bitcoin’s market dominance’s dropped by 40.6% and Ethereum took over 32% of the market amidst the situation.
In reference to the data provided by Blockchain Center, there are also other metrics apart from market cap that determines the Flippening. As of now, Bitcoin is still by far superior in trading volume, which is a crucial metric for adoption usage. However, Ethereum has Bitcoin beat in active addresses, transaction count and volume, and total USD transaction fees.
Outperformance of Ethereum will be primarily driven by the strength of its post-Merge fundamentals. The upcoming Shanghai Upgrade will significantly reduce the risk and opportunity cost of staking ETH, which is likely to attract participation from more crypto users.
Key Takeaway
Despite Ethereum’s increasing adoption and market dominance, Bitcoin still reigns supreme in the crypto space. In fact, Bitcoin saw significant adoption in 2021-2022 from retail and institutional investors, public companies, and even countries. As of now, El Savador and the Central African Republic (CAR) have adopted Bitcoin as a legal currency. This is a monumental step towards mainstream adoption.
But that is not to say the Flippening will never happen — it is certainly a possibility. After all, both Bitcoin and Ethereum have different visions. Bitcoin aims to become the global reserve currency, whereas Ethereum aims to become the infrastructure of a global digital economy. The Technology Acceptance Model (TAM) applies to both assets, but it all comes down to supply and demand mechanisms. If demand in digital money is higher, then Bitcoin dominates. But if demand in utility-based asset in building out a decentralized ecosystem is higher, then Ethereum is generally favored.
The Federal Reserve’s December meeting minutes revealed the central bank’s plans to continue raising the federal funds rate to control rising inflation. This could potentially impact the crypto market as economic activity is further tightened, signalling consumers and investors to save money and mitigate risk. Shortly after the news, the price of Bitcoin and Ethereum had dropped momentarily before bouncing back to the $16800 and $1250 range respectively.
Key Takeaways:
Feds opted to raise interest rates by 50 basis points, putting the target range for federal funds rate to 4.25%-4.5%.
The new restrictive policy in place will fight inflation, but it also tightens economic activity including investments in the crypto market.
The price of Bitcoin and Ethereum dropped 1% after the Federal Reserve’s December meeting minutes were released.
The Fed’s minutes noted the collapse of digital asset exchange FTX, but said it didn’t have a serious effect on the wider financial system.
Fed Signals Hawkish Interest Hikes in 2023
The Federal Open Market Committee (FOMC) and Federal Reserve officials concluded its December 13-14 meeting, publishing new projections for expected inflation in 2023 which is higher than previously anticipated. Against the macro backdrop, Fed officials agreed to raise interest rates by 50 basis points, putting the target range for the federal funds rate to 4.25%-4.5%.
Higher interest rates mean higher borrowing costs, which in turn affects consumer spending and investments in speculative markets including the stock market and crypto market. The news of the Fed’s plans to continue raising interest rates has caused investors to be cautious, as they are wary of its potential impact on the crypto market. Occasions such as this would prompt traders and investors to sell U.S. equities as well as Bitcoin and other digital assets to mitigate risk.
This caused the price of Bitcoin to dip nearly 1%. Ethereum, the second largest digital asset by market cap, also dropped by 1%. According to Cryptowatch, the correlation between Bitcoin and Ethereum sits strong at 0.82. Therefore, it is expected that Ethereum will mirror Bitcoin’s price movement.
Despite the dip, Bitcoin is still up 0.4% in the past 24 hours and 1.2% in the past week. Ethereum is down 0.1% at the time of writing but has seen 5.1% gains in the past week.
Fed officials also noted the collapse of FTX, acknowledging its impact on the crypto ecosystem. However, they claimed that the situation did not have a serious effect on the wider financial system. The meeting summary stated, “while the spillovers from this situation had been significant among other crypto lenders and exchanges, the collapse was not seen as posing broader market risks to the financial system. (Valium) ”