ETHGas has launched Chapter 1 of their “Gasless Future” initiative featuring the Beanstalk Bonanza campaign. Users can earn Beans (reward points) by completing quests and referring friends, with the goal of building a community around their vision to eliminate gas fees from Ethereum. The campaign launched September 11, 2025, and positions participants as “Founding Members” of their gasless future mission.
How to Participate: Step-by-Step Guide
Getting Started (Earn Your First 10 Beans)
Step 1: Visit the Onboarding Page Go to ethgas.com/community/onboarding to begin your journey. Use JT0R1YL for referral code and extra beans.
Step 2: Link Your X (Twitter) Account
Click “Link X Account” on the onboarding page
This allows ETHGas to verify your participation and track rewards
Important: They will never post without your permission
Step 3: Authorize ETHGas Official
Complete the authorization process to verify your account
Step 4: Complete Onboarding
Click “Continue” to finish the process
You’ll see the “You’re Onboarded!” confirmation screen
Reward: Earn your first 10 Beans for joining as a Founding Member
Advanced Earning: The Referral System
Once onboarded, access your Community Dashboard to find your unique referral link. Share this link to unlock powerful earning opportunities:
Referral Milestone Rewards
Referrals
Title
Bean Reward
5 users
SEEDLING SPROUT 🌱
50 Beans
10 users
STALK STRENGTHENER 🌳
100 Beans
20 users
GROWTH GURU ✨
250 Beans
50 users
VINE VIRTUOSO 🌿
350 Beans
100 users
BEANSTALK BARON 👑
450 Beans
Power-Up Rewards (After 100 Referrals)
Supercharged Referrals: Earn 2 Beans for every additional user you onboard (up to 500)
Network Effect: Earn 1 Bean for every indirect referral (when your friends refer others)
Tracking Your Progress
Monitor your advancement through the Referral History section on your Dashboard by clicking “View” next to your referrals count. ethgas
The ETHGas Project: Vision & Value Proposition
Core Mission: Eliminating Ethereum Gas Fees
ETHGas represents a fundamental challenge to the current Ethereum ecosystem through their “Gasless Future” initiative. Their mission centers around solving one of blockchain’s most persistent user experience problems: prohibitive gas fees that limit accessibility and adoption.
The Gassy Jack Narrative
The project uses Gassy Jack, a friendly donkey mascot, to represent every user’s struggle with high gas fees. As stated in their campaign materials: “We’re all Gassy Jack. We’ve all felt the sting of high gas fees while exploring the world of DeFi.”ethgas
Key Value Propositions
1. Community-Driven Solution
Building a coalition of users committed to gasless infrastructure
Rewarding early adopters and advocates through the Bean system
Creating network effects through referral incentives
2. Chapter-Based Development
Structured rollout beginning with community building (Chapter 1)
Future chapters will likely introduce technical solutions
Sustainable, long-term approach to ecosystem transformation
3. Real-Time Ethereum Focus
Emphasis on “realtime Ethereum” suggests infrastructure improvements
Positioning Beans as “your stake in the future of realtime Ethereum” x.com
Strategic Approach
The Beanstalk Bonanza represents more than a typical campaign—it’s a community mobilization effort. By gamifying the onboarding process and creating milestone achievements, ETHGas is building a foundation of committed users who have a vested interest in their gasless future vision.
The project’s emphasis on “every quest you complete and every friend you refer helps Jack’s beanstalk grow taller, stronger, and closer to freedom” indicates a collaborative approach where community growth directly correlates to technological advancement toward their gasless goals. ethgas
What’s Next
ETHGas has positioned Chapter 1 as the beginning of a multi-phase journey. While technical details of their gasless solution remain undisclosed, the community-first approach suggests future chapters will introduce infrastructure, partnerships, or technological innovations that build upon this initial user base.
Get Started: Visit ethgas.com/community/onboarding to join the mission and earn your first Beans as a Founding Member of the Gasless Future initiative.
Welcome to the second part of our crypto trading guide series for beginners! In this article, we’ll tackle two critical pillars of successful trading: risk management and trader psychology. Mastering these skills ensures you can trade with consistency, avoid emotional pitfalls, and protect your capital for the long term. We’ll break down how to manage risk effectively, maintain emotional discipline, and understand the psychological journey of a trader.
Understanding Risk Management and Psychology
Risk management is about protecting your capital by controlling how much you’re willing to lose on each trade, while trader psychology focuses on managing your emotions to stay disciplined and consistent. Together, they form the backbone of profitable trading.
Without proper risk management, even the best setups can wipe out your account, and without psychological discipline, fear or greed can derail your strategy. For beginners, we’ll focus on the following concepts:
1% Risk Rule
Risk-to-Reward Ratios (RR)
Win Rates
The 1% Risk Rule and Position Sizing
The cornerstone of risk management is the 1% risk rule: never risk more than 1% of your portfolio on a single trade. This keeps losses small, allowing you to survive losing streaks and stay in the game long enough to profit. Let’s see how to apply this with an example.
Example: BTC Trade Setup (May 8 2025)
Let’s say we have a $10,000 portfolio, so our 1% risk is $100. On May 8, BTC has broken above previous Friday High and we’re looking to take a long at the retest of that key level at $97,868 while placing our stop-loss at previous Friday Low at $96,306.9 (1.6% drop from our entry).
The first thing we should do is to calculate our position size.
Position Size = Risk Amount ÷ Stop-Loss Percentage
In our example, that would be $100 ÷ 0.016 = $6,250. Our position size is $6,250, meaning we can buy $6,250 worth of BTC at $97,868.
If the stop-loss hits at $96,306.9, we lose $100. If the take-profit hits at $100,000, we make $136.59. You can use TradingView or Bybit to calculate this!
Figure 2. TradingView Long Position ToolFigure 3. Bybit Spot Order
Different trading tools and exchanges will likely have different names for “portfolio” and “position size” on their interface. Just so that you are not confused with the terminologies:
“Account Size” on TradingView and “Available Balance” on Bybit refers to your portfolio.
“Lot Size” on TradingView and “Order Value” on Bybit refers to your position size.
Using Leverage for Trading
When your calculated position size exceeds your portfolio, leverage becomes a tool to bridge that gap, enabling you to take the trade without risking more than your 1% rule allows.
In other words, if your account size is smaller than the position size needed for a trade, leverage lets you borrow funds to meet that position size. Let’s see how to use leverage effectively by determining the right leverage amount based on your account size and position size.
Figure 4. SOLUSDT.P on Bybit
Let’s say we have a $10,000 portfolio, so our 1% risk is $100. We’re looking to go long on SOL at $162.34 while placing our stop-loss at $161.34 (0.62% drop from our entry). This means our position size is $100 ÷ 0.0062 = $16,129.03. Since our position size is larger than our account size ($16,129.03 > $10,000), we will need leverage to take this trade.
To determine the leverage needed, divide the position size by the account size: $16,129.03 ÷ $10,000 = 1.61x leverage.
This means we can use 1.61x leverage on our $10,000 to achieve the $16,129.03 position size. Bybit is a strong choice for leveraged trades, as the platform allows you to customize your leverage settings with precise adjustments, such as 3.5x or 8.33x, helping you achieve your position size with accuracy.
Alternatively, we could use a smaller portion of our account, say $5,000 (half of our portfolio), at a higher leverage to achieve the same position size: $16,129.03 ÷ $5,000 = 3.23x leverage. Either way, any leverage setting we use would still result in a $100 loss if our stop-loss at $161.34 is hit. This also means the profit would be the same in any leverage setting.
This is the correct way to use leverage for trading. At the end of the day, it does not matter how high or low the leverage setting is as long as our risk is managed properly!
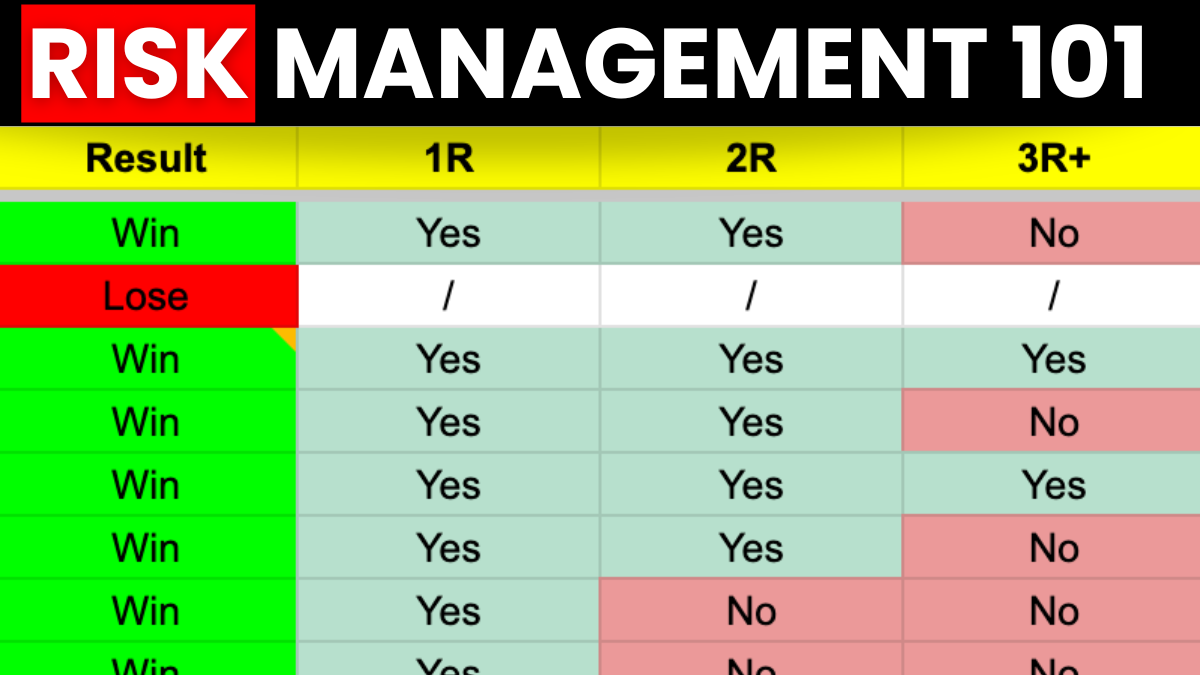
Using Risk-to-Reward Ratio (RR)
The risk-to-reward ratio (RR) measures the potential profit of a trade relative to its potential loss, expressed as a ratio. For example, a 2R trade (or 2:1) means you’re risking 1 unit of loss to potentially gain 2 units of profit—such as risking $100 to make $200. In the BTC trade example above, you can see that it was a 1.37R trade where we are risking $100 to make around $137 and in the SOL leveraged trade example as well where it was a 4.87R trade, risking $100 to make $487.
In this guide, we use R to represent 1% of your portfolio, so a 2R setup risks 1% to gain 2%, and a 3R setup risks 1% to gain 3%.
The rule of thumb in trading is to aim at least for a 1R setup. Focus on higher RR setups.This ensures that even with a lower win rate, your winners outweigh your losers. However, there are different strategies to go about this which we will discuss in the next section.
Win Rate Strategies
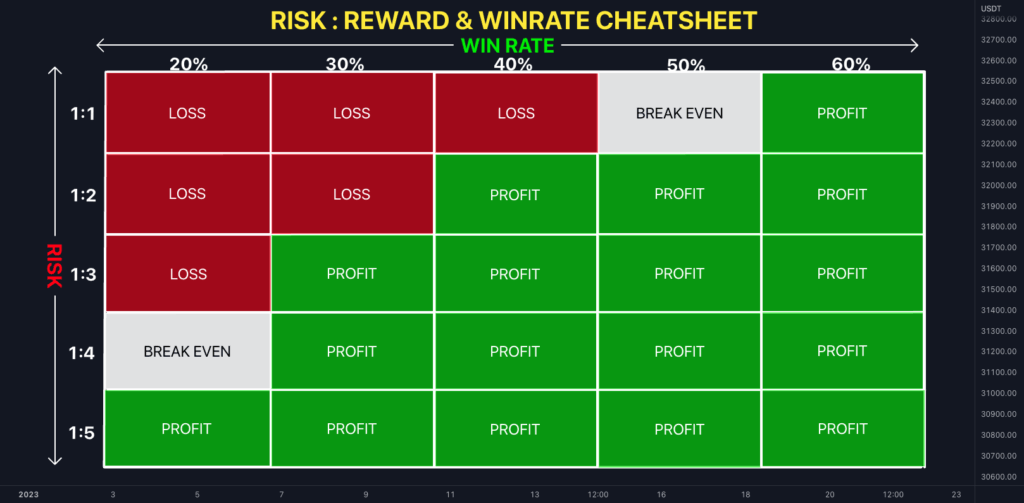
Figure 5. Risk:Reward & Win-Rate Cheatsheet by QuantVue (Source: TradingView)
Win rates determine your long-term profitability, but they’re often misunderstood, especially by beginners who think a high win-rate means success. While a high win rate (e.g., 70%–80%) might seem like the key to profitability, it’s not the only factor. Your risk-to-reward ratio (RR) plays a crucial role in balancing your strategy.
A high win rate with a low RR (e.g., 1R) can lead to smaller gains that don’t cover losses over time, while a lower win rate with a high RR (e.g., 3R or higher) can make you profitable even if you lose more trades. Refer to figure 5, if you are targeting for 1R setups only, you will need more than 50% win-rate to be profitable. On the other hand, if you are targeting for 3R setups only, you only need a 30% win rate.
Different traders prefer different strategies based on their risk tolerance and trading style: some aim for a high win rate with 1R setups, focusing on consistency and frequent small wins, while others target 3R or higher setups with a lower win rate, prioritizing larger gains per trade to offset more frequent losses.
The Psychological Journey: Loss Aversion
Trader psychology is a rollercoaster, and for beginners, one of the biggest challenges is dealing with losing streaks, especially when trading live. Loss aversion—a powerful cognitive bias—makes the pain of losing feel twice as intense as the joy of winning, according to behavioral finance research by Daniel Kahneman and Amos Tversky in their Prospect Theory. This bias can lead beginners to hold onto losing trades too long, hoping for a reversal, or to exit winning trades too early out of fear of losing gains, resulting in poor risk-reward outcomes.
Imagine you’re a beginner with a $5,000 portfolio, following the 1% risk rule, risking $50 per trade. You take 10 trades, but hit a losing streak of five trades in a row. After the first loss, your account drops to $4,950, and the sting of that $50 loss hits hard—emotionally, it feels much worse than a $50 gain would feel good. By the fifth loss, your account is down to $4,754.95, a total loss of $245.05. Despite the 1% rule keeping your financial risk small, the emotional toll of losing streak after losing streak can be overwhelming.
Research shows that 70%–80% of traders experience heightened emotions during market volatility, often leading 40% of retail traders to exit trades prematurely due to fear, according to a 2025 study on forex trading psychology. This stress can cause beginners to question their strategy, even when it’s statistically sound, and may push them toward impulsive decisions like revenge trading—taking larger positions to “make back” losses—or quitting altogether.
In live trading, even with good risk management, the stress of a losing streak can test your mental fortitude. The key question is: do you have the mental fortitude to continue trading through the inevitable losses, trusting your strategy’s edge over time, or will loss aversion derail your journey?
Conclusion
Risk management and psychology are about consistency, not perfection. The most important principle is to always risk the least to make the most, using the 1% rule, high RRR setups, and hedging to keep losses small and profits significant. Psychologically, accept that you’ll go through cycles—losing streaks will test your mental fortitude, but with discipline, you can become a full-time trader. Start with small risks, like $50 on a $5,000 portfolio, and focus on learning through real trades. Stay tuned for the next part of our series on confirmation vs. deviation!
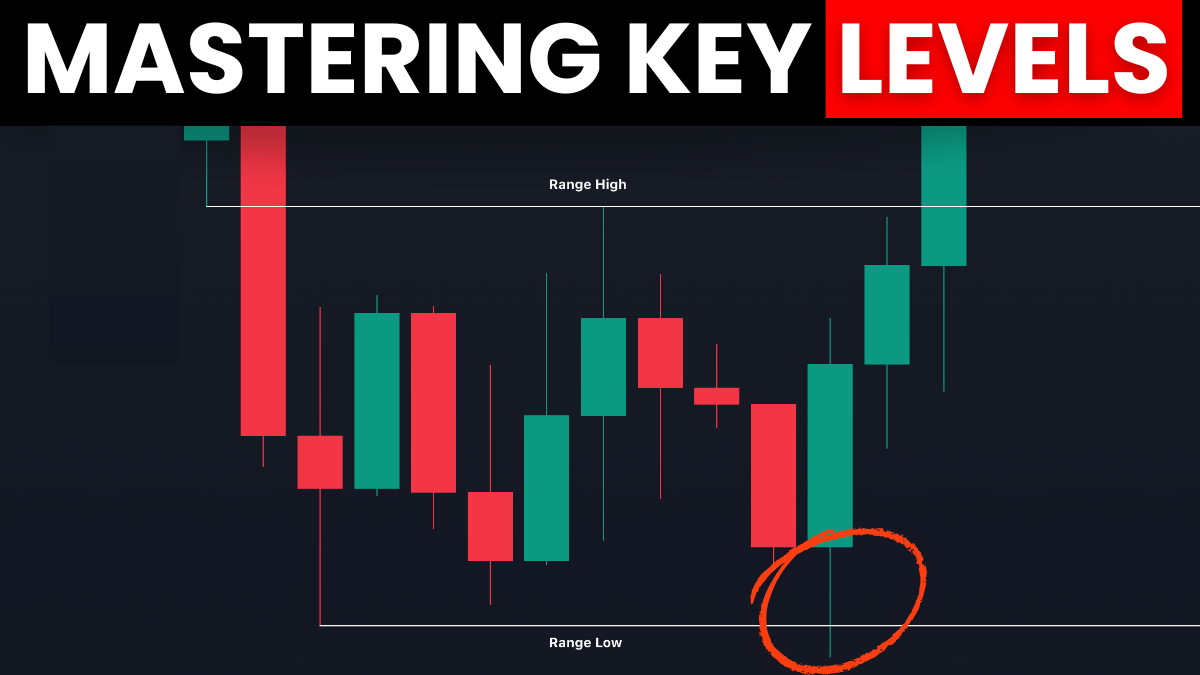
Welcome to one of the most essential skills in price action trading: identifying key levels. These are specific price points on a chart where the market tends to react, either by reversing, consolidating, or breaking out. For beginners, mastering key levels means you can make smarter trading decisions with just a few simple lines on your chart. In this guide, we’ll break down what key levels are, how to identify them, and how to use them with recent examples from Bitcoin (BTC) and Ethereum (ETH). Let’s dive in!
4 Types of Key Levels
Before we start, let’s understand the four types of key levels you’ll encounter:
Technical Key Levels: These are based purely on technical analysis (TA) and price action—your bread and butter as a trader.
Weekly Levels: These are tied to weekly market sessions, specifically Monday highs, Monday lows, Friday highs, and Friday lows, reflecting the opening and closing of traditional stock markets.
Psychological Levels: These are round numbers that retail traders focus on, like $100,000 for BTC or $4,000 for ETH. They’re popular because they’re easy to spot and often trigger buying or selling.
Event-Based Levels: These are tied to major market events, like Federal Reserve announcements or crypto-specific news (e.g., ETF approvals). They’re less common but can influence price action.
For beginners, we’ll focus on technical key levels and weekly session key levels in this article, as they’re the most reliable and practical for everyday trading. We’ll also use recent BTC and ETH examples to show how these levels work in real markets.
Identifying Technical Key Levels
Technical key levels are price points where the market has shown significant reactions—think strong bounces, rejections, or breakouts. To find them, you’ll create ranges on your chart, which consist of three main components: range low, range high, and mid-range. Here’s how to spot them:
Range Low: This is a swing low where the price bounces strongly after a dump. It acts as support.
Range High: This is a level where the price faces resistance, often rejecting or breaking out after a rally.
Mid-Range: Defining a mid-range is not necessarily the halfway point between the range low and range high, but rather a “loose” S/R level where price often finds reactions. Price action is almost always volatile around this key level and requires careful analysis.
Let’s walk through a step-by-step process using a recent BTC example. I will also be referring to specific dates in the images below. But since I do not want to clutter the chart, you can open your TradingView to refer to those dates if you want to follow along without any confusion!
From February to May 2025, BTC was trading in a range between $78,210.5 (range low) and $95,058.7 (range high). Now I know what you’re thinking: price has dumped to as low as $74,456.2 and pumped to as high as $97,868 (marked by the yellow semi circles), but how are those price points not considered as range low and range high? These are called “deviations” and we will explain this in the next article (you don’t need to know this yet as they are for actual trade executions, whereas identifying key levels is generally the strategy part).
Range Low ($78,210.5): From February 24 to February 28, BTC dumped from $96,536.3 to $78,210.5 with almost no sustaining buying pressure. But from February 28 to March 2, BTC bounced sharply from $78,210.5 to $95,058.7. This strong bounce confirms $78,210.5 as the range low, acting as support.
Range High ($95,078.7): Shortly after BTC rallied to $95,078.7, price failed to go any higher and rejected strongly the following days. What makes this an even stronger range high is the fact that price nearly retested the $96,536.3 price point on February 24 which triggered the sharp dump in the first place.
Mid-Range ($87,178): The middle of this range, around $87,178, saw choppy price action. It primarily acted as a “mini resistance” from March 7 to April 20 where price rejects every time it retested $87,178. But on April 21, the daily candle closed above the mid-range which showed buying strength, and the following day BTC pumped to as high as $94,000 after retesting the mid-range on market open. From there on, the mid-range acts as a support if price reverses from the range high. This is also known as a higher time frame (HTF) support/resistance (S/R) flip region, as it’s significant on both 4-hour and daily charts.
The Tricky Thing about Mid-Range
Mid-ranges can change as price action develops over time. Look at the chart below and you will see that there was another mid-range at $85,023.4 (marked by the yellow dotted line). Price found its way there after the rejection off of range high and had another strong bounce to $92,781.6 before reversing to the downside again and retesting the range low.
Figure 2. BTCUSDT.P on Bybit (1D Timeframe)
The yellow dotted line was the S/R region before April 21. But after the breakout on April 21 and more importantly the strong continuation on April 22, we now see the bigger picture – there is an imbalance of liquidity created by the buyers on April 21 and 22. At some point in the future, it is likely those areas will get filled which overlaps with the current mid-range (white dotted lines).
Anyways, the most important principle you have to remember is the more reactions the key level have seen, the more valid they are as a key level, and this is especially applicable to mid-ranges. The current mid-range of BTC as shown above still saw multiple rejections same as the previous mid-range.
What Happens If Price Breaks Out of Range?
Figure 3. ETHUSDT.P on Bybit (3D Timeframe)
From January 22, 2024 to March 3, 2025, ETH was trading in a range between $2,167.17 and $4096.21. For the longest time, the range low held strongly as an HTF support – price had bounced sharply from the range low 3 times. But on March 9, 2025, price has completely broken below the range low and failed to reclaim it the following week. This means the yellow-lined ranges are no longer in play.
In such situations, we will need to look further back to identify previous pivot points and establish our new key levels.
Figure 4. ETHUSDT.P on Bybit (1W Timeframe)
Going all the way back to January 2022, we have marked out previous pivot points and used those areas as our new key levels for ETH.
New Range Low ($877.7): Price dumped from $3,581 to $877.7 and then strong bounce from there to $2,029.4. Remember, the first swing low often serves as the range low.
New Range High ($3,581): Marked from the initial dump at $3,581 in April 2022. You can also use the previous range high at $4,096.21 (figure 4) as the current range high – there’s nothing wrong with that! However, if you look closely, you will notice the price action above $3,581 are “swing failure patterns” which you will learn in the next article along with “deviations”.
New Mid-Range ($2,155): Notice how the previous range low (figure 3) coincides with our new mid-range. Yes! More often than not, new mid-ranges come from previous range lows (if bearish) and previous range highs (if bullish).This is because it is in the nature of mid-ranges to play the critical role of S/R flip regions. Look closely and you will see that before January 2024, $2,155 was a strong resistance for ETH until it flipped support from there on until the collapse on March 9, 2025.
Now let’s bring up both the yellow and white ranges and you will see the full picture.
Figure 5. ETHUSDT.P on Bybit (1W Timeframe)
So in terms of our current play for ETH, until the current mid-range at $2,155 is reclaimed, there is a possibility that the range low, though not guaranteed, will be retested.
Identifying Weekly Session Key Levels
Weekly levels are based on significant price points from the start and end of the trading week—specifically Monday highs, Monday lows, Friday highs, and Friday lows. These levels reflect the opening and closing dynamics of traditional markets and are often respected in crypto trading as well. They’re excellent for short-term trades, helping you set precise entry points, stop-losses, and take-profit targets. Plus, they can act as liquidity zones where market makers might target stop-losses, so you’ll need to watch for potential traps.
Let’s look at a real-world example using Bitcoin (BTC) on a 4-hour chart from early May 2025. The chart marks key weekly levels from the previous week and the start of the current week, giving us a clear framework to work with.
Figure 6. BTCUSDT.P on Bybit (4H Timeframe)
Previous Friday High ($97,868.0): This was the highest price on the last trading day of the previous week (May 2). It acts as a resistance level.
Previous Friday Low ($96,306.9): The lowest price on that Friday, serving as a support level.
Monday High ($95,149.0): The highest price on Monday, May 5, 2025, acting as a potential resistance or target.
Monday Low ($93,460.2): The lowest price on Monday, serving as a key support level.
Here’s how these levels played out and how you can use them in your trading:
Friday Levels as a Range: The Previous Friday High ($97,868.0) and Low ($96,306.9) form a range that price often respects. On May 2, the price reached $97,868.0 but rejected sharply, dropping to $95,500.0 by May 3. This rejection confirms the Friday High as a strong resistance. The price then consolidated near the Friday Low ($96,306.9) on May 4, showing that this level acted as support during the decline.
Monday Levels as Support/Resistance: On Monday, May 5, the price dropped to the Monday Low ($93,460.2) early in the session, marking a significant support level. It then bounced sharply, rallying to the Monday High ($95,149.0) later that day. The Monday Low held as support when the price retested it on May 6, bouncing to $94,500.0. Meanwhile, the Monday High ($95,149.0) acted as resistance on May 7, where the price wicked above but rejected back down to $94,300.0.
Trading Application: Let’s say you’re looking to trade on May 6 after the price bounces from the Monday Low ($93,460.2). You could enter a long position at $93,600.0, targeting the Monday High ($95,149.0) or even the Previous Friday Low ($96,306.9) for a higher reward. Place your stop-loss just below the Monday Low, around $93,300.0, to protect against a breakdown. This setup gives you a high reward-to-risk (RR) ratio: the distance to $96,306.9 (2,706.9 points) is much larger than your risk (300 points), yielding a 9:1 RR.
Liquidity Traps: Notice the wick below the Monday Low ($93,460.2) on May 5, dropping briefly before bouncing. This is a classic liquidity grab—market makers likely pushed the price below to hit stop-losses before reversing. Similarly, the rejection at the Previous Friday High ($97,868.0) on May 2 trapped breakout buyers. Be cautious around these levels, as wicks often signal traps.
How to Use Weekly Levels in Practice?
If the price holds above the Monday Low ($93,460.2), look for longs targeting the Monday High ($95,149.0) or Previous Friday Low ($96,306.9). If it breaks below, consider shorts targeting the next support, like $92,500.0 (a recent swing low). For stop-losses, place them just outside the weekly levels—below the Monday Low for longs, or above the Friday High for shorts—to avoid being caught in liquidity grabs.
Tips for Weekly Levels
Mark the Levels: Use UTC timezone to identify Monday and Friday key levels. On the chart, draw lines at the highs and lows of those candles. For example, the Monday High ($95,149.0) and Low ($93,460.2) on May 5 are clear markers for the week.
Watch for Reactions: Look for rejections, bounces, or breakouts at these levels. The rejection at $97,868.0 (Previous Friday High) and the bounce from $93,460.2 (Monday Low) show how price respects these zones.
Combine with Other Levels: Weekly levels work best when paired with technical levels (like mid-ranges or HTF S/R flips). For instance, if the Monday Low aligns with a mid-range, it’s an even stronger support.
Ever since ETFs for BTC and ETH have been approved, large institutional players have become involved with trading BTC and ETH. This makes weekly levels a powerful tool for short-term trades. They give you clear targets and stop-loss zones, but always be mindful of liquidity traps, as seen with the wicks around these levels.
Conclusion
The most important principle to take away from identifying key levels in price action trading is that the more reactions a key level has seen, the more valid and reliable it becomes. Whether it’s a range low, range high, mid-range, or weekly level, the significance of a price point grows with each bounce, rejection, or breakout it experiences, as these reactions reflect the market’s memory and the involvement of both retail and institutional players.
Key levels give you clarity by giving structure to the market’s historical data. But remember, this is just the planning part. Even if you have mastered this part at identifying key levels, the actual trade executions can be very different. We will cover this in the next article.